Case Study 6: NDVI Time-Series Analysis for Vegetation Monitoring
Generating a time-series chart to analyze seasonal vegetation dynamics and long-term trends using the Normalized Difference Vegetation Index (NDVI).
Introduction to NDVI Time-Series
While a single NDVI image provides a snapshot of vegetation health, a **time-series** analysis unlocks the ability to see how forests change over months and years. By plotting the NDVI for a specific location through time, we can track the **phenology**—or seasonal life cycle—of a forest, observing its green-up in the wet season and senescence in the dry season. This is essential for monitoring forest health, detecting the impacts of drought, assessing recovery after disturbances like fires or logging, and identifying subtle, long-term degradation that might not be visible in a single image.
Analysis Workflow
1. Define Region of Interest (ROI)
Specify a single point or a small polygon as the ROI for which the time-series will be generated.
2. Load and Process Image Collection
Load a long-term satellite data collection (e.g., Landsat 8 from 2014-2025). Apply functions to mask clouds and scale the pixel values to true surface reflectance.
3. Calculate NDVI for Each Image
Map a function over the entire image collection to calculate the NDVI for every image, adding it as a new band.
4. Generate Time-Series Chart
Use the `ui.Chart.image.series` function to plot the mean NDVI value within the ROI for every image in the collection over time.
Chart Visualization
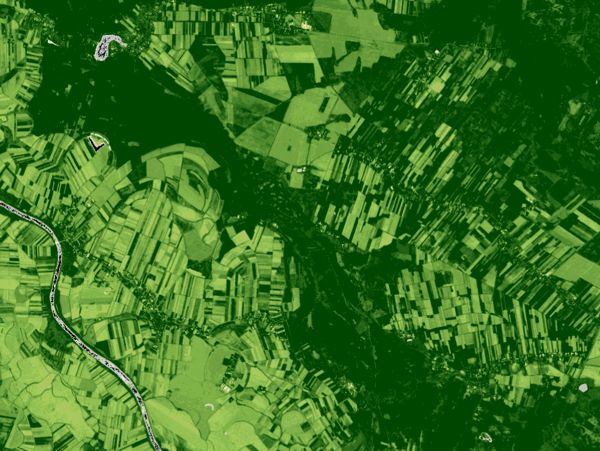
The primary output of this analysis is not a map layer, but an interactive chart that appears in the GEE Console. The chart plots NDVI on the y-axis against time on the x-axis, revealing the vegetation's seasonal cycles.
GEE Code Snippet
This script generates a time-series chart of NDVI for a specific point over several years, showing seasonal vegetation cycles.
// NOTE: You must define a 'roi' Point or Polygon before running.
Map.centerObject(roi, 17);
Map.addLayer(roi, {color: 'FF0000'}, 'Region of Interest');

// Function to scale and mask Landsat 8.
function scaleAndMaskL8(image) {
  var qa = image.select('QA_PIXEL');
  var cloudBitMask = 1 << 3;
  var cloudShadowBitMask = 1 << 4;
  var mask = qa.bitwiseAnd(cloudBitMask).eq(0).and(qa.bitwiseAnd(cloudShadowBitMask).eq(0));
  var opticalBands = image.select('SR_B.').multiply(0.0000275).add(-0.2);
  return image.addBands(opticalBands, null, true).updateMask(mask);
}

// Function to calculate NDVI.
function addNDVI(image) {
  var ndvi = image.normalizedDifference(['SR_B5', 'SR_B4']).rename('NDVI');
  return image.addBands(ndvi);
}

// Load and process the image collection.
var l8Collection = ee.ImageCollection('LANDSAT/LC08/C02/T1_L2')
                      .filterDate('2014-01-01', '2025-12-31')
                      .filterBounds(roi)
                      .map(scaleAndMaskL8)
                      .map(addNDVI);

// Create the time-series chart.
var ndviChart = ui.Chart.image.series({
  imageCollection: l8Collection.select('NDVI'),
  region: roi,
  reducer: ee.Reducer.mean(),
  scale: 30,
  xProperty: 'system:time_start'
}).setOptions({
  title: 'Landsat 8 NDVI Over Time',
  vAxis: {title: 'NDVI Value'},
  hAxis: {title: 'Date', format: 'YYYY-MM'},
  interpolateNulls: true,
});

// Print the chart to the console.
print(ndviChart);
Analysis & Results
The primary result of this script is the **time-series chart** generated in the GEE Console. This chart provides a powerful visualization of the forest's health and seasonality over a decade. The y-axis represents the NDVI value (a proxy for vegetation greenness and density), while the x-axis represents time.
A key pattern to observe is the **annual cyclical trend**. In regions with distinct wet and dry seasons, you will see NDVI values peak during the wet season when foliage is densest and drop during the dry season. The consistency of these peaks and troughs year after year indicates a stable, healthy ecosystem. Any significant deviation, such as a much lower peak during a drought year or a failure to recover after a disturbance, can be easily identified.
Furthermore, the overall long-term trend can be assessed. Is the average NDVI slowly declining over the years, suggesting gradual degradation? Or is it increasing, indicating forest recovery or growth? This type of detailed temporal analysis is impossible with single-date imagery and is fundamental for effective, long-term forest monitoring.