Case Study 4: Forest Area Identification with Machine Learning
Using a supervised Random Forest classifier to distinguish between forest and non-forest land cover from Sentinel-2 satellite imagery.
Introduction to Supervised Classification
Creating an accurate map of forest cover is a fundamental task in forestry. **Supervised classification** is a powerful machine learning technique where we "teach" a model to recognize different land cover types. We do this by providing it with training data—examples of what "forest" and "non-forest" areas look like in a satellite image. The algorithm, in this case, **Random Forest**, learns the unique spectral signatures of these classes. It then uses this knowledge to classify every pixel in the entire image, resulting in a detailed land cover map. This method is highly effective for creating accurate baseline data for forest monitoring and management.
Analysis Workflow
1. Define Training Data and AOI
Provide ground-truth data by defining points for known forest and non-forest areas. Define a larger Area of Interest (AOI) for the classification.
2. Filter and Prepare Satellite Imagery
Load the Sentinel-2 image collection, then filter it by date, location (AOI), and cloud cover to create a single, clean median composite image.
3. Sample Data and Train the Classifier
Extract the pixel values (spectral signatures) from the image at the training point locations. Split this data into training (70%) and validation (30%) sets, then train the Random Forest classifier.
4. Classify Image and Assess Accuracy
Apply the trained classifier to the entire image. Use the reserved validation data to test the model's performance and print an error matrix and overall accuracy score.
5. Visualize the Final Map
Display the final classified map, using a distinct color palette to show the forest and non-forest areas.
Map Visualization
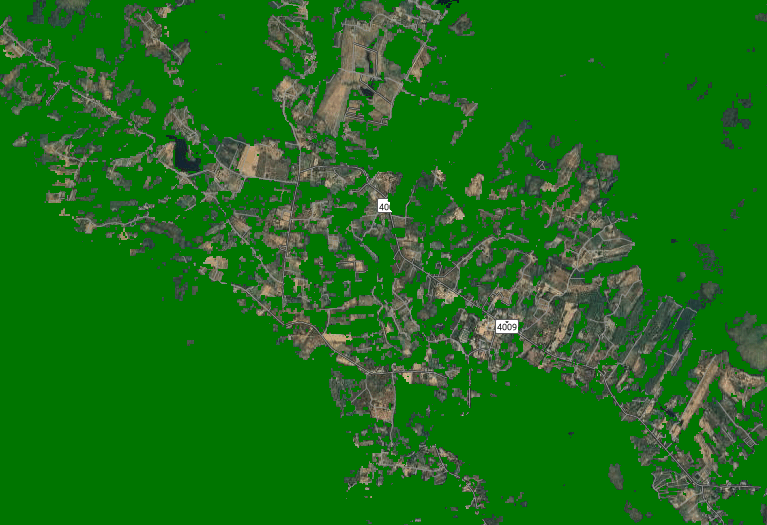
The final map displays the output of the Random Forest classification. Green areas represent pixels classified as 'Forest', while yellow areas represent 'Non-Forest'.
GEE Code Snippet
This script trains a Random Forest classifier on user-defined points to map forest cover from Sentinel-2 data and assesses its accuracy.
// Get Ground truth data
var forest = ee.FeatureCollection('users/your-username/forest_points'); // Example path
var nonforest = ee.FeatureCollection('users/your-username/nonforest_points'); // Example path

// Load Sentinel-2 image collection.
var s2 = ee.ImageCollection("COPERNICUS/S2");

// Define an area of interest (AOI).
var aoi = ee.Geometry.Polygon(
    [[[99.038, 13.380], [99.038, 12.553], [100.106, 12.553], [100.106, 13.380]]], null, false);

// Filter and preprocess the image collection.
var image = s2
  .filterBounds(aoi)
  .filterDate("2024-01-01", "2024-02-01")
  .filter(ee.Filter.lt("CLOUDY_PIXEL_PERCENTAGE", 5))
  .median()
  .clip(aoi);

// Prepare training data.
var trainingPoints = forest.merge(nonforest);

// Sample training data from the image.
var sample = image.sampleRegions({
  collection: trainingPoints,
  properties: ['landcover'],
  scale: 30
});

// Split data into training (70%) and validation (30%).
var sampleWithRandom = sample.randomColumn('random', 42);
var training = sampleWithRandom.filter(ee.Filter.lt('random', 0.7));
var validation = sampleWithRandom.filter(ee.Filter.gte('random', 0.7));

// Train a classifier.
var classifier = ee.Classifier.smileRandomForest(10).train({
  features: training,
  classProperty: 'landcover',
  inputProperties: image.bandNames()
});

// Classify the image.
var classified = image.classify(classifier);

// Assess accuracy.
var validationClassified = validation.classify(classifier);
var errorMatrix = validationClassified.errorMatrix('landcover', 'classification');
print('Error Matrix:', errorMatrix);
print('Overall Accuracy:', errorMatrix.accuracy());

// Define visualization parameters and display results.
var visParams = {min: 0, max: 1, palette: ["yellow", "green"]};
Map.centerObject(aoi, 9);
Map.addLayer(classified, visParams, "Classified Image");
Map.addLayer(trainingPoints, {color: 'red'}, "Training Points");
Analysis & Results
The final classified map successfully distinguishes between forested and non-forested areas within the specified region. The **green pixels** represent areas that the Random Forest model identified as forest based on the spectral signatures learned from the training data. Conversely, the **yellow pixels** represent non-forest areas, which could include agriculture, urban areas, or water bodies.
The most critical output for evaluating this analysis is the **Overall Accuracy** printed in the console. This metric, derived from the error matrix, tells us the percentage of validation pixels that were correctly classified by the model. A high accuracy (typically >90%) indicates that the training data was representative and the model is reliable. If the accuracy is low, it suggests that more or better-quality training points are needed.
This type of binary forest map is a foundational dataset for many forestry applications. It can be used to calculate the total forest area, as a baseline for deforestation monitoring (by comparing maps from different years), and to identify areas for potential reforestation initiatives.