Case Study 3: Assessing Forest Fire Burn Severity
Using pre-fire and post-fire satellite imagery to map the ecological impact of a wildfire and quantify the severity of the burn.
Introduction to Burn Severity Mapping
Forest fires are a natural part of many ecosystems, but their intensity and impact can vary greatly. **Burn severity** is a measure of the ecological change caused by a fire. Mapping it is essential for post-fire management, helping foresters to prioritize areas for erosion control, monitor natural regeneration, and plan reforestation efforts. This is typically done by calculating the **Normalized Burn Ratio (NBR)**, an index that uses the Near-Infrared (NIR) and Short-Wave Infrared (SWIR) bands, which are sensitive to changes in vegetation health and soil moisture. By comparing the NBR from before and after a fire, we can create a **differenced NBR (dNBR)** map that quantifies the severity of the burn.
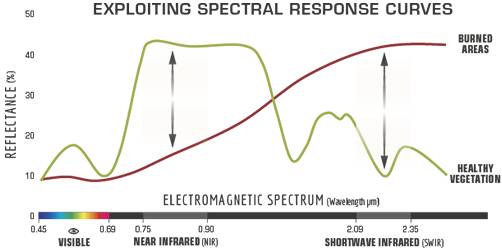
Analysis Workflow
1. Define Time Periods and AOI
Specify the date ranges for immediately before and after the fire event, and define the Area of Interest (AOI) around the fire perimeter.
2. Filter and Cloud-Mask Imagery
Load Sentinel-2 or Landsat imagery for both periods, filtering by date and location. Apply a cloud-masking function to create clean, analysis-ready images.
3. Calculate NBR and dNBR
Calculate the Normalized Burn Ratio (NBR) for both the pre-fire and post-fire images. Subtract the post-fire NBR from the pre-fire NBR to get the dNBR.
4. Classify Severity
Apply established dNBR thresholds to classify the image into different severity classes, such as High, Moderate, Low, and Unburned.
5. Visualize and Quantify Results
Visualize the classified map with a legend and calculate the area (in hectares) for each severity class within the AOI.
Map Visualization
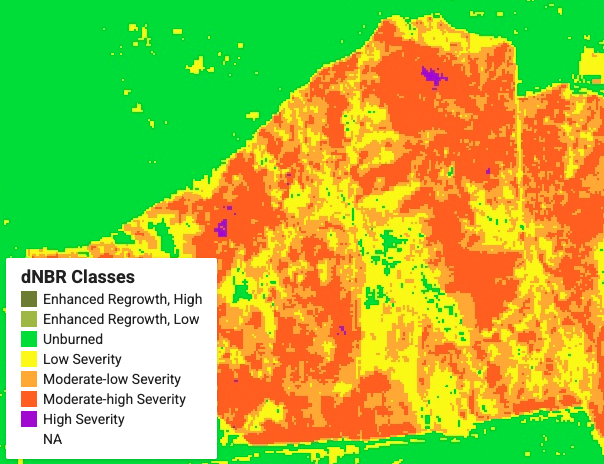
The map below shows the classified burn severity. Colors range from green (unburned) and yellow (low severity) to red and purple (high severity), clearly delineating the fire's impact on the landscape.
GEE Code Snippet
This script processes pre- and post-fire imagery to calculate and classify the differenced Normalized Burn Ratio (dNBR), and adds a legend to the map.
// NOTE: You must define a 'boundary' FeatureCollection before running.
var prefire_start = '2019-01-01';
var prefire_end = '2020-02-15';
var postfire_start = '2020-02-20';
var postfire_end = '2020-02-22';
var platform = 'S2'; // Sentinel-2 or Landsat 8

var ImCol = (platform == 'S2') ? 'COPERNICUS/S2' : 'LANDSAT/LC08/C01/T1_SR';
var area = ee.FeatureCollection(boundary);
Map.setCenter(101.7784, 16.87633, 12);

// Filter image collections for pre- and post-fire periods.
var prefireImCol = ee.ImageCollection(ImCol).filterDate(prefire_start, prefire_end).filterBounds(area);
var postfireImCol = ee.ImageCollection(ImCol).filterDate(postfire_start, postfire_end).filterBounds(area);

// Cloud masking functions for S2 and L8.
function maskS2sr(image) {
  var qa = image.select('QA60');
  var cloudBitMask = 1 << 10;
  var cirrusBitMask = 1 << 11;
  var mask = qa.bitwiseAnd(cloudBitMask).eq(0).and(qa.bitwiseAnd(cirrusBitMask).eq(0));
  return image.updateMask(mask).copyProperties(image, ["system:time_start"]);
}
// ... [L8 mask function would be here] ...

// Apply cloud mask.
var prefire_CM_ImCol = prefireImCol.map(maskS2sr);
var postfire_CM_ImCol = postfireImCol.map(maskS2sr);

// Create mosaics and calculate NBR.
var pre_cm_mos = prefire_CM_ImCol.mosaic().clip(area);
var post_cm_mos = postfire_CM_ImCol.mosaic().clip(area);
var preNBR = pre_cm_mos.normalizedDifference(['B8', 'B12']);
var postNBR = post_cm_mos.normalizedDifference(['B8', 'B12']);

// Calculate dNBR.
var dNBR = preNBR.subtract(postNBR).multiply(1000);

// Define SLD style for classification visualization.
var sld_intervals =
  '<RasterSymbolizer>' +
    '<ColorMap type="intervals" extended="false" >' +
      '<ColorMapEntry color="#7a8737" quantity="-250" label="-250" />' +
      '<ColorMapEntry color="#acbe4d" quantity="-100" label="-100" />' +
      '<ColorMapEntry color="#0ae042" quantity="100" label="100" />' +
      '<ColorMapEntry color="#fff70b" quantity="270" label="270" />' +
      '<ColorMapEntry color="#ffaf38" quantity="440" label="440" />' +
      '<ColorMapEntry color="#ff641b" quantity="660" label="660" />' +
      '<ColorMapEntry color="#a41fd6" quantity="2000" label="2000" />' +
    '</ColorMap>' +
  '</RasterSymbolizer>';
Map.addLayer(dNBR.sldStyle(sld_intervals), {}, 'dNBR classified');

// ... [Legend and Area Calculation code follows] ...
Analysis & Results
The final classified dNBR map provides a rapid and accurate assessment of the fire's ecological impact. The areas in **red and purple** clearly delineate regions of **high and moderate-high severity burn**, where the majority of the vegetation has been consumed and soil is exposed. These are critical priority zones for post-fire management to mitigate soil erosion and potential landslides.
Areas in **yellow and orange** indicate **low to moderate-low severity**, where the fire likely burned through the understory but left the main forest canopy largely intact. These areas may recover more quickly on their own. The **green** areas represent **unburned** land within the fire perimeter, serving as important refuges for wildlife and seed sources for natural regeneration.
By quantifying the area of each severity class, forest managers can efficiently allocate resources, such as deploying erosion control measures in the most severely burned areas and focusing monitoring efforts on the natural recovery of moderately burned zones. This type of analysis is fundamental to modern, data-driven wildfire response and forest restoration.
Reference
https://un-spider.org/advisory-support/recommended-practices/recommended-practice-burn-severity/burn-severity-earth-engine