Case Study 1: Regional Climate Analysis with WorldClim
Visualizing Mean Annual Temperature across Southeast Asia to understand regional climate patterns relevant to forestry.
Introduction to Regional Climate Analysis
WorldClim is a high-resolution global climate dataset that provides long-term monthly average climate data. While powerful for single-country analysis, its true strength lies in regional studies. By analyzing climate variables across multiple countries, we can understand transboundary ecosystem characteristics, model species distribution on a larger scale, and assess regional climate vulnerabilities. This case study demonstrates how to efficiently filter, clip, and visualize Mean Annual Temperature for several countries in Southeast Asia, providing a cohesive view of the region's thermal landscape.
Analysis Workflow
1. Define a Country List
Create a list of country names to define the regional Area of Interest (AOI).
2. Filter Country Boundaries
Load a global dataset of country boundaries and use the list to filter for the desired features, creating a multi-country AOI.
3. Select and Process Climate Data
Load the WorldClim dataset, select the Mean Annual Temperature band ('bio01'), and apply the necessary scaling factor.
4. Clip and Visualize
Clip the global climate data to the multi-country AOI and add it to the map with a color palette to show temperature variation.
Map Visualization
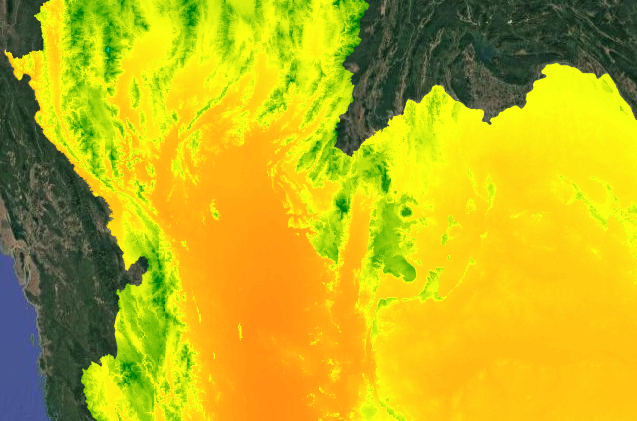
The map below shows the Mean Annual Temperature across mainland Southeast Asia. The color gradient from blue (cooler) to red (hotter) reveals the regional climate patterns.
GEE Code Snippet
This script defines a list of countries, filters a feature collection to create a regional AOI, and maps the mean annual temperature.
// Define a list of countries for the analysis.
var countryList = ["Thailand", "Malaysia", "Laos", "Burma", "Cambodia", "Vietnam"];

// Load country boundaries and filter by the list.
var countries = ee.FeatureCollection('USDOS/LSIB_SIMPLE/2017')
  .filter(ee.Filter.inList("country_na", countryList));

// Load WorldClim data and select the mean annual temperature band ('bio01').
var dataset = ee.Image('WORLDCLIM/V1/BIO');
var image = dataset.select('bio01').multiply(0.1);

// Define visualization parameters for temperature in degrees Celsius.
var visParams = {
  min: 10,
  max: 30,
  palette: ['blue', 'purple', 'cyan', 'green', 'yellow', 'red'],
};

// Center the map on the region and add the clipped temperature layer.
Map.setCenter(100.407, 14.534, 5);
Map.addLayer(image.clip(countries), visParams, 'Mean Annual Temperature');

// Print image metadata to the console.
print(image);
Analysis & Results
The resulting map provides a clear visualization of the mean annual temperature across mainland Southeast Asia. A distinct latitudinal gradient is visible, with cooler average temperatures (cyan and green) in the northern, more mountainous regions of Myanmar, Laos, and Vietnam.
In contrast, the central plains of Thailand and Cambodia, along with peninsular Malaysia, show consistently hotter temperatures (yellow and red). This regional view is far more informative than looking at a single country in isolation, as it highlights how climate patterns transcend political boundaries and shape entire ecosystems.
For regional forestry planning, this analysis is fundamental. It helps identify large-scale climate corridors, assess the suitability of vast areas for specific forest restoration goals, and provides a crucial baseline for understanding how regional climate change may uniformly or disparately affect the forests of these neighboring countries.