Assignment 4: Forest Type Classification with Multiple Predictors
Use Random Forest with multiple data sources to create a detailed forest type map.
Why Use Multiple Predictors?
A simple classification might only use the spectral bands of an image. However, we can create a much more accurate and intelligent model by providing it with more data. In this assignment, you will combine Sentinel-2 imagery with a **vegetation index (NDVI)** and **topographic data (elevation)**. Different forest types grow at different elevations and have different greenness values. By giving the Random Forest algorithm this extra information, it can make better decisions and distinguish between classes like **Evergreen Forest** and **Deciduous Forest** more effectively.
Instructions
Create Multi-Class Training Data
In the GEE Code Editor, create at least four `FeatureCollection`s for different land cover types, such as `evergreen`, `deciduous`, `water`, and `urban`. Digitize at least 20 points/polygons for each class.
Build Your Predictor Image
Create a cloud-free Sentinel-2 composite. Then, calculate NDVI from it. Load a Digital Elevation Model (DEM) dataset. Finally, stack all these layers (Sentinel bands, NDVI, elevation) into a single multi-band image using `.addBands()`.
Sample, Split, and Train
Merge your multi-class training collections. Use `sampleRegions` to extract the predictor values for each point. Split the data and train a `smileRandomForest` classifier as before.
Classify and Assess Accuracy
Classify your multi-band predictor image. Use the validation set to generate an `errorMatrix` and print the overall accuracy to the console.
Visualize the Multi-Class Map
Add your final classified map to the viewer, using a new color palette that assigns a unique color to each land cover class.
Starter Code Snippet
Use this code in the GEE Code Editor. You will need to create the feature collections for each class yourself.
// IMPORTANT: Create FeatureCollections for each class (e.g., 'evergreen', 'deciduous', 'water').
// Add a property 'landcover' to each feature with a unique integer for each class
// (e.g., 0 for evergreen, 1 for deciduous, 2 for water, etc.).

// Define an area of interest (AOI).
var aoi = ee.Geometry.Polygon(
    [[[99.03, 13.38], [99.03, 12.55], [100.10, 12.55], [100.10, 13.38]]], null, false);

// --- 1. PREPARE PREDICTORS ---
// Create a Sentinel-2 composite.
var s2image = ee.ImageCollection("COPERNICUS/S2_SR")
  .filterBounds(aoi)
  .filterDate("2023-11-01", "2024-02-28") // Dry season for better visibility
  .filter(ee.Filter.lt("CLOUDY_PIXEL_PERCENTAGE", 10))
  .median()
  .clip(aoi);

// Add NDVI as a band. NIR='B8', Red='B4' for Sentinel-2.
var ndvi = s2image.normalizedDifference(['B8', 'B4']).rename('NDVI');

// Add Elevation data as a band.
var dem = ee.Image('USGS/SRTMGL1_003').clip(aoi).rename('elevation');

// Stack all predictor bands into one image.
var image = s2image.addBands(ndvi).addBands(dem);
var bands = image.bandNames(); // Get all band names for the classifier

// --- 2. PREPARE TRAINING DATA ---
// Merge the feature collections.
var trainingPoints = evergreen.merge(deciduous).merge(water).merge(urban);

// Sample the predictor values at the training points.
var sample = image.sampleRegions({
  collection: trainingPoints,
  properties: ['landcover'],
  scale: 10
});

// Split data into training (70%) and validation (30%).
var sampleWithRandom = sample.randomColumn();
var training = sampleWithRandom.filter(ee.Filter.lt('random', 0.7));
var validation = sampleWithRandom.filter(ee.Filter.gte('random', 0.7));

// --- 3. TRAIN AND CLASSIFY ---
// Train a classifier.
var classifier = ee.Classifier.smileRandomForest(50).train({
  features: training,
  classProperty: 'landcover',
  inputProperties: bands
});

// Classify the image.
var classified = image.classify(classifier);

// --- 4. ASSESS AND VISUALIZE ---
// Assess accuracy.
var errorMatrix = validation.classify(classifier).errorMatrix('landcover', 'classification');
print('Overall Accuracy:', errorMatrix.accuracy());

// Define a palette for the multi-class map and display it.
var visParams = {min: 0, max: 3, palette: ['#006400', '#32CD32', '#4682B4', '#C0C0C0']}; // Dark Green, Lime Green, Blue, Grey
Map.centerObject(aoi, 9);
Map.addLayer(classified, visParams, "Classified Forest Types");
Expected Result
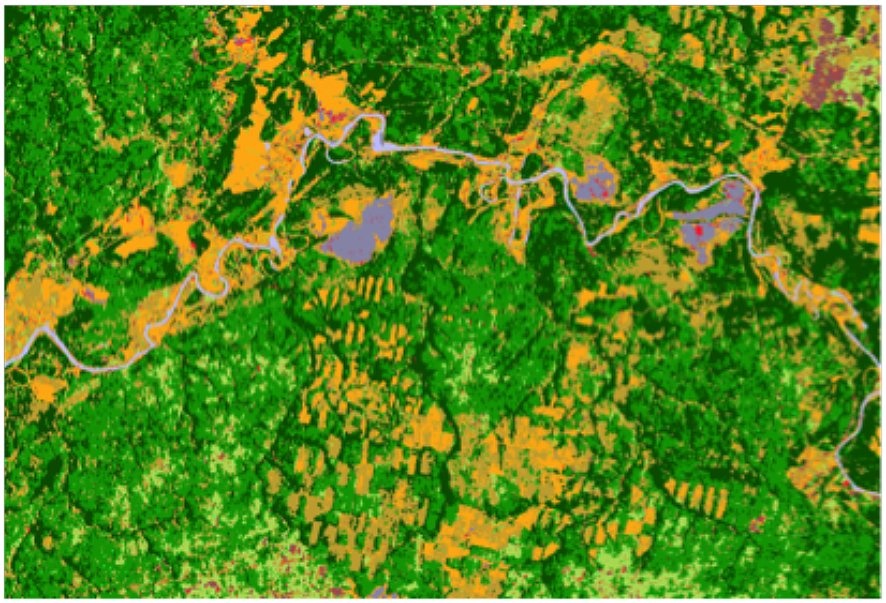
Your final map will show a detailed classification with different colors for each forest type and land cover class you defined. The console will report a high overall accuracy, demonstrating the power of using multiple predictors in your model.