Assignment 1: Calculate NDVI
Your task is to calculate the Normalized Difference Vegetation Index (NDVI) for a specific region and time period.
What is NDVI?
NDVI is a simple graphical indicator that can be used to analyze remote sensing measurements and assess whether the target being observed contains live green vegetation or not. It is calculated using the Near-Infrared (NIR) and Red bands of a satellite image. The formula is: NDVI = (NIR - Red) / (NIR + Red). Values range from -1 to +1, where higher values typically indicate healthier or denser vegetation.
Instructions
Select a Region
Choose any area of interest (AOI) in the world. You can use the geometry drawing tools in the GEE Code Editor to define a point, rectangle, or polygon.
Load and Filter Data
Load a Landsat 8 Surface Reflectance image collection. Filter it for a recent, cloud-free image over your AOI. A good time frame is usually a few months (e.g., last summer).
Calculate NDVI
Use the `.normalizedDifference()` function on your selected image. Remember that for Landsat 8, the NIR band is 'B5' and the Red band is 'B4'.
Visualize the Result
Add the resulting NDVI layer to the map. Use a color palette to visualize the output, for example, making low NDVI values brown and high values green.
Starter Code Snippet
Copy and paste this code into the GEE Code Editor to get started. Fill in the missing parts.
// 1. Define your area of interest (AOI). For example, a point.
var point = ee.Geometry.Point([-122.27, 37.87]); // Example: Berkeley, CA

// 2. Load Landsat 8 data and filter it.
var image = ee.ImageCollection('LANDSAT/LC08/C01/T1_SR')
    .filterBounds(point)
    .filterDate('2020-06-01', '2020-08-31')
    .sort('CLOUD_COVER')
    .first();

// 3. Calculate NDVI. NIR='B5', Red='B4'.
// --- YOUR CODE HERE ---
var ndvi = /* ... use normalizedDifference() ... */;


// 4. Define a color palette for visualization.
var ndviPalette = ['CE7E45', 'DF923D', 'F1B555', 'FCD163', '99B718',
               '74A901', '66A000', '529400', '3E8601', '207401',
               '056201', '004C00', '023B01', '012E01', '011D01',
               '011301'];

// Center the map and add the layers.
Map.centerObject(point, 10);
Map.addLayer(image, {bands: ['B4', 'B3', 'B2'], min: 0, max: 3000}, 'RGB');
// --- YOUR CODE HERE ---
// Map.addLayer(ndvi, {min: 0, max: 1, palette: ndviPalette}, 'NDVI');
Expected Result
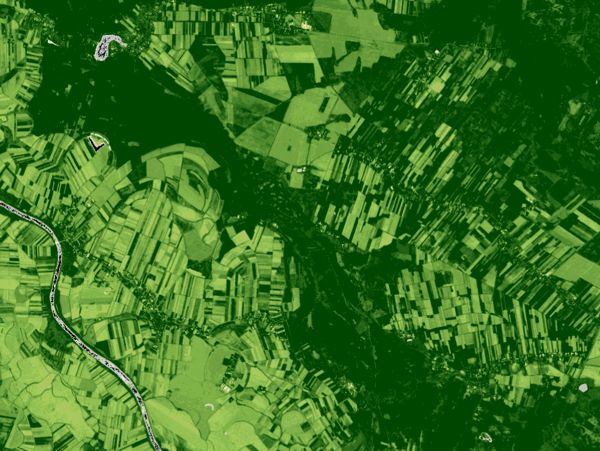
Your final map should display a layer representing NDVI, where vegetated areas appear in shades of green and non-vegetated areas (like water or urban centers) appear in shades of yellow or brown.